
|
Every industry has stats. Sports, automotive, financial, natural products, computers, education, music, you name it. They all have statistics and charts that show trends, sales, participation etc. Some of these are proprietary, while others are made public. Let’s focus on the public ones, since those are the ones you can use in your blog for content copywriting. These charts come with stories attached to them. Oftentimes, when they are published by the market research firm, they come with analysis which can help you get started. Here is an example of what I mean. 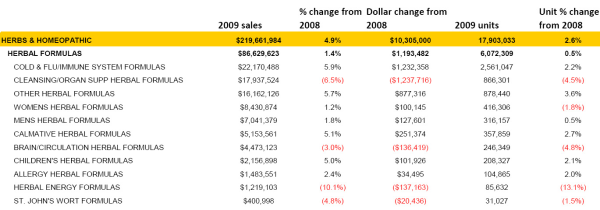 This chart came from Natural Foods Merchandiser in their Market Overview issue. From this chart you can talk about a number of natural products marketing issues.
This post does not have to be long. The data alone is good information, and your insight positions you as a leader in that category. And best of all, you can do this in an hour or less. Blog writing made easy. Next Week: Commenting on other articles
0 Comments
Your comment will be posted after it is approved.
Leave a Reply. |
AuthorArchives
June 2011
Categories
All
|
 RSS Feed
|
Pioneer Communications Group is a marketing firm that specializes in helping small businesses that want to engage with their customers and prospects effectively, and profitably. We are expert in marketing strategy, communications, market research, marketing automation, and content creation. © 2016-Pioneer Communications Group
|